Introduction
Scientific Figure Analysis (SFA) is a challenging task requiring the extraction of analytical insights from figures by integrating visual and textual inputs, surpassing surface-level descriptions in conventional tasks like captioning. It demands visual recognition, scientific knowledge integration, contextual reasoning, and multimodal comprehension . While multimodal large language models (MLLMs) have advanced in image-to-text tasks, their ability to perform high-level scientific analysis remains unclear. Existing datasets focus on descriptive accuracy rather than analytical depth, lacking scientific context for evaluating reasoning about complex data .
To address this, we introduce AnaFig, a dataset designed to assess three key MLLM capabilities: adherence to complex scientific instructions, multimodal perception, and analytical summarization. Comprising 1,000 samples from eight physics subfields, each sample pairs figures with descriptive text from research papers, requiring analytical summaries synthesizing key insights . A five-dimensional scoring framework (faithfulness, completeness, conciseness, logicality, depth of analysis) ensures rigorous evaluation, with human-expert summaries and 5,000 score labels establishing a benchmark. Testing five MLLMs reveals performance gaps in analytical depth compared to human experts, highlighting the need for improved scientific reasoning in MLLMs .
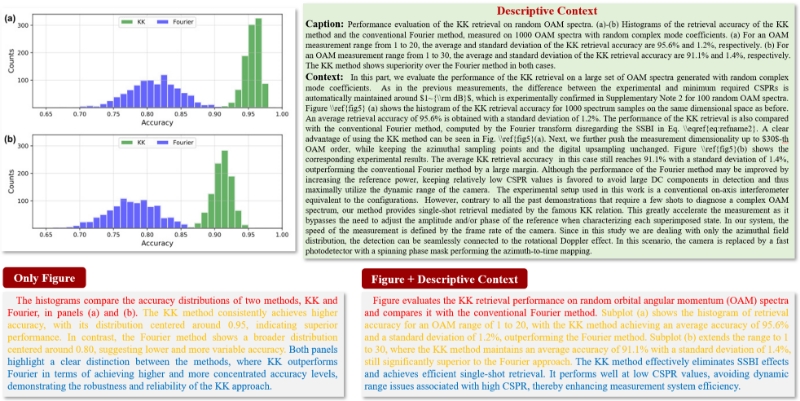
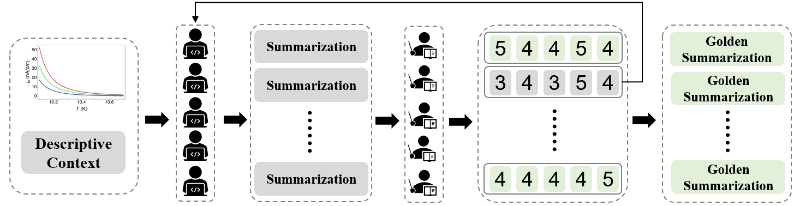
Importance of descriptive contextual information on the quality of analytical summaries. Different color fonts represent the corresponding different qualities of the generated content.
AnaFig-Dataset Overview
The AnaFig dataset is designed to evaluate multimodal large language models (MLLMs) in Scientific Figure Analysis (SFA), focusing on three core capabilities: following complex instructions, multimodal perception, and analytical summarization.
- 1,000 high-quality samples from 8 physics subfields
- Multimodal input: figure + caption + contextual text
- 5-dimensional evaluation framework (Faithfulness, Completeness, Conciseness, Logicality, Depth of Analysis)
- 5,000 expert-assigned score labels
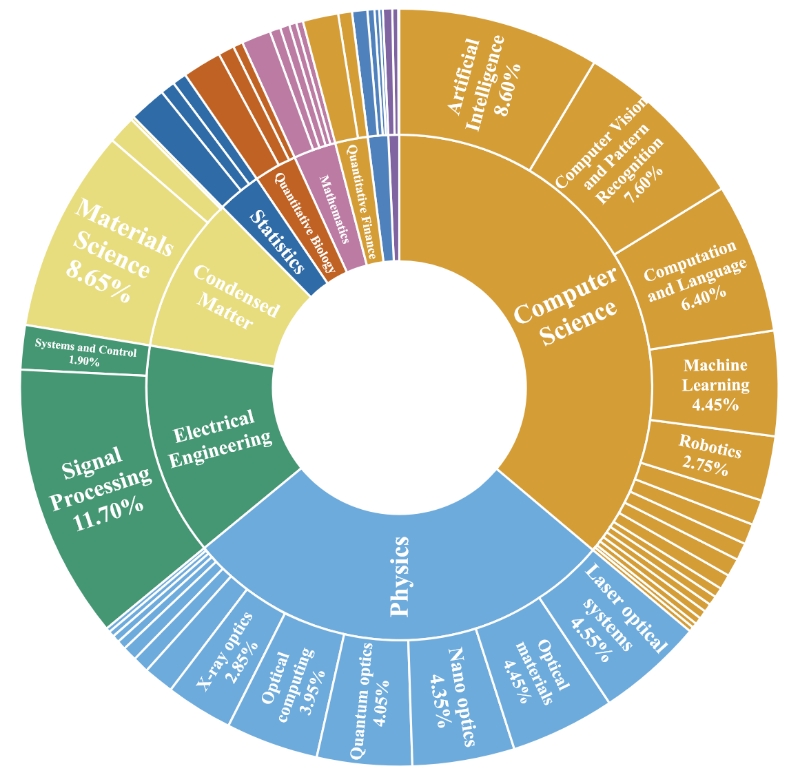
Statistics of figure application domains, an example input of AnaFig.
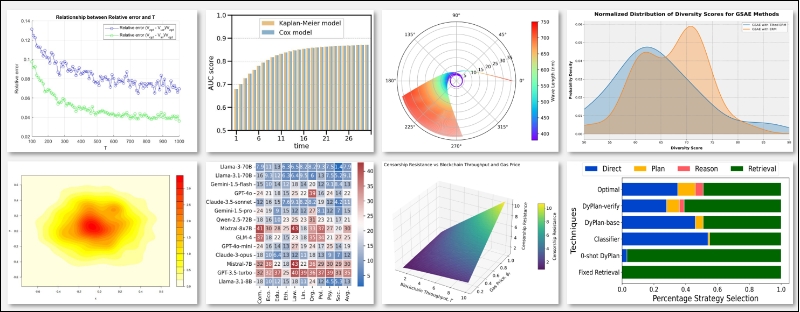
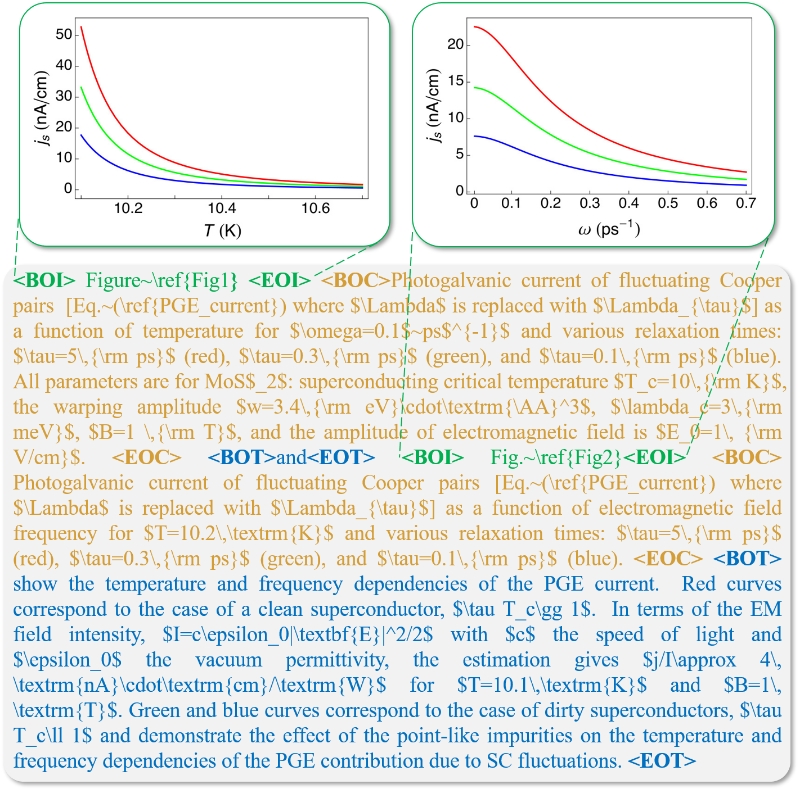
Examples of figure types.
Annotation and Scoring Process of AnaFig Dataset
The annotation process of AnaFig involves ten physics experts, with five acting as initial annotators to generate summaries based on established criteria and the other five as checkers to independently evaluate and score all 1,000 data samples, where summaries scoring 3 or lower on any of the five dimensions (faithfulness, completeness, conciseness, logicality, depth of analysis) are iteratively revised until all dimensions achieve a score of 4 or higher; the five-dimensional evaluation criteria include faithfulness (strictly adhering to the information in figures and descriptions), completeness (encompassing all key information and trends in figures), conciseness (avoiding redundant information), logicality (being logically coherent and consistent with expert knowledge), and depth of analysis (providing insightful and thorough data understanding), with checkers assigning scores from 1 to 5 for each criterion to ensure high-quality, human-aligned summaries and evaluations.
AnaFig dataset annotation and scoring process.
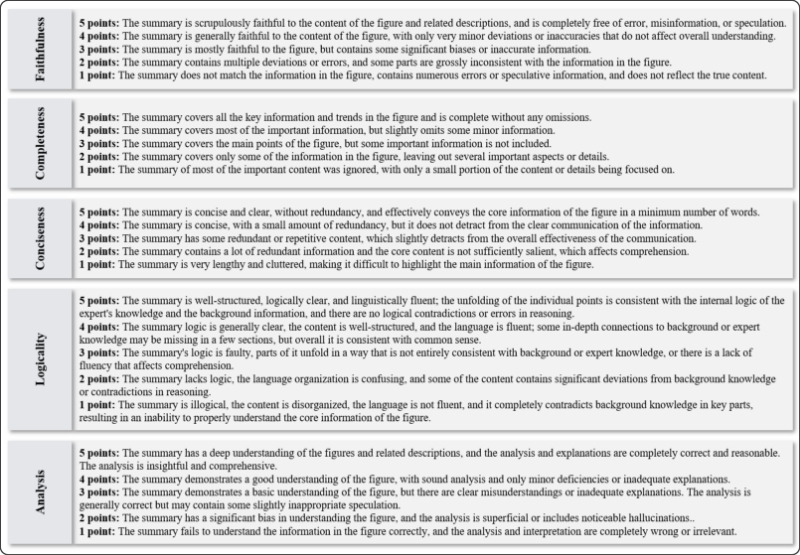
Detailed evaluation criteria.
Benchmark Results
Results of various evaluation methods in summarization-level. MET.=METEOR, R1=ROUGE1, R2=ROUGE2, RL=ROUGEL:
| Model | BLEU | MET. | BERT Score | ROUGE | MLLM-Score | ||
|---|---|---|---|---|---|---|---|
| R1 | R2 | RL | |||||
| Qwen2-2B | 0.0954 | 0.2878 | 0.1750 | 0.4605 | 0.2103 | 0.3135 | 3.36 |
| MiniCPM | 0.0991 | 0.3621 | 0.2550 | 0.5026 | 0.2180 | 0.3165 | 3.82 |
| InterVL2.5 | 0.0645 | 0.3126 | 0.2154 | 0.4618 | 0.1728 | 0.2792 | 3.73 |
| Qwen2-7B | 0.1214 | 0.3846 | 0.2585 | 0.5051 | 0.2509 | 0.3423 | 3.80 |
| Claude-3 | 0.1003 | 0.3810 | 0.2654 | 0.4792 | 0.2252 | 0.3106 | 3.89 |
| GPT-4o | 0.0893 | 0.3204 | 0.2931 | 0.5148 | 0.2067 | 0.3218 | 3.90 |
| Gemini-1.5 | 0.0993 | 0.3330 | 0.2960 | 0.5222 | 0.2159 | 0.3228 | 3.95 |
| Claude-3.5 | 0.1024 | 0.3645 | 0.2903 | 0.5114 | 0.2274 | 0.3153 | 3.98 |
MLLM Score in ffve-dimensional evaluation:
| Model | Fai | Com | Con | Log | Ana | Avg |
|---|---|---|---|---|---|---|
| Human | 4.78/5 | 4.52/5 | 4.37/5 | 4.71/5 | 4.66/5 | 4.61/5 |
| Qwen2-VL-2B | 3.48/5 | 2.95/5 | 3.97/5 | 3.66/5 | 2.72/5 | 3.36/5 |
| MiniCPM | 3.80/5 | 3.77/5 | 3.84/5 | 4.18/5 | 3.51/5 | 3.82/5 |
| InternVL2.5 | 3.64/5 | 3.72/5 | 3.80/5 | 4.05/5 | 3.47/5 | 3.73/5 |
| Qwen2-VL-7B | 3.86/5 | 3.60/5 | 3.94/5 | 4.26/5 | 3.35/5 | 3.80/5 |
| Claude-3 | 3.86/5 | 3.76/5 | 3.98/5 | 4.27/5 | 3.57/5 | 3.89/5 |
| GPT-4o | 3.88/5 | 3.63/5 | 4.16/5 | 4.26/5 | 3.58/5 | 3.90/5 |
| Gemini-1.5 | 3.87/5 | 3.65/5 | 4.35/5 | 4.38/5 | 3.49/5 | 3.95/5 |
| Claude-3.5 | 3.91/5 | 3.79/5 | 4.05/5 | 4.40/5 | 3.78/5 | 3.98/5 |
| Average | 3.78/5 | 3.61/5 | 4.01/5 | 4.18/5 | 3.43/5 | 3.80/5 |
Quick Start
                        # Clone the Git environment and download the dataset images.
                        git clone https://github.com/yuetanbupt/AnaFig.git
                        cd images
                        wget https://drive.usercontent.google.com/download?id=1szWDGkZXbw67u9WGy_qrs8GNjRaiFFPg&export=download&confirm=t&uuid=8222368e-2802-4aea-8f99-3a30237bfc8a
                        unzip AnaFig-image.zip && rm AnaFig-image.zip

                        # Install dependencies
                        pip install -r requirements.txt

                        # Call the API to run a closed - source model for summary generation
                        python model/API_gen.py \
                            --api_link $api_link \
                            --model_name $model_name \
                            --api_key $openai_key

                        # Call the API to run a closed - source model to score the previously generated summarization
                        python model/API_eval.py \
                            --file_name $file_name \
                            --api_link $api_link \
                            --model_name $model_name \
                            --api_key $openai_key